Table of Contents
The relationships between these factors create qualitative and quantitative ratios:
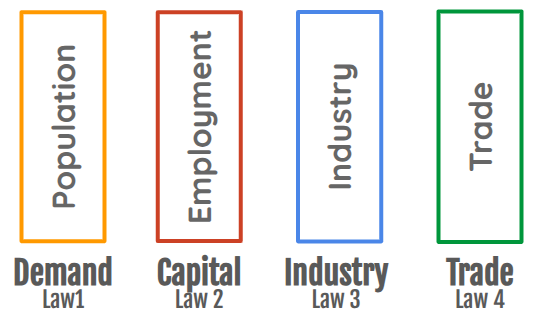
| Type | Demand The needs and wants of the people | Capital Available potential effort | Trade The exchange of productions or spreading of the effort | Industry The actual kinetic effort or production |
|---|---|---|---|---|
| Quantitative | Population Size P, Youth or Age Y, Female-Male Ratio F |
Employment J, Education L, Incoming Investments Ii, Outgoing investments Xi |
Nominal GDP Growth G, Rate Of Interest R, Inflation N, Debt D, Imports It, Exports Xt, Economic Value V |
Real GDP in Dollar or Grain Value G, Grain Value Initiated By Government O Grain Value Initiated By Services S, Grain Value Initiated By Agriculture A, Grain Value Initiated By Manufacturing M |
| Qualitative | GP, VP, GF, VF, GY, VY |
GJ, VJ, GL, VL, VIi, VXi |
GO, VO, GS, VS, GA, VA, GM, VM |
GR, GN, GD, GIt, GXt, VIt, VXt |
| Supereconomic Indicators | Change in Grain Value G, Number of Users P, Average Age of Users Y, Average Female-Male Ratio F |
Change In Grain Value G, Users Without Job Contracts For X Months J, Users Without Learning or Training Contracts For Y Years L |
R Interest Rate of Clearing Funds or Point banks, Grain Index, Inflation N, Debt via Points banking D, Value of imports via Pool It, Value of exports via Pool* Xt |
Grain value of govt contracts O, Grain value of service contracts S, Grain value of agri contracts A, Grain value of product contracts M |
| Goal | Minimum Requirements | Real Price via the Economic Table | Economic Growth (this is the only aspect that Modern Economics focuses on) | Economic balance or stasis |
*The grain value of exports includes the GOSAM that was involved, with additional as the increased cost of transportation
These ratios describe the socio-economic nature of the society in question. This mirrors the ‘harmonic’ ratios of Kepler’s Platonic Solids and is very different from Economics which favors equations. This usefulness of this is proven by the usefulness of financial ratios used by the Capitalist system.
We can classify the ratios into the following:
| Demand Ratios | Description |
|---|---|
GP |
population size per rise or fall in the economy. A slope that is too high indicates overpopulation |
GF |
the portion of the economy that goes to males or females |
GY |
the share of the economy per age (youth). A rising slope may indicate a rise or fall in education as the society gets wealthier. |
| Capital Ratios | Description |
|---|---|
GJ |
the rise or fall in unemployment as the society gets wealthier. A rising slope may indicate inequality or oligarchy |
GL |
the rise or fall in education as the society gets wealthier. A rising slope may indicate investments in higher education and austere morals as opposed to liberal morals |
GIi |
the rise or fall in inbound investments as the society gets wealthier. A rising slope may indicate a young country. |
GXi |
the rise or fall in outbound investments as the society gets wealthier. A rising slope may indicate an old country. |
| Industry Ratios | Description |
|---|---|
GO |
the rise or fall in government as the society gets wealthier. A rising slope may likewise indicate the spread of austere morals as state control, as opposed to liberalism |
GS |
the rise or fall in services as the society gets wealthier. A rising slope may indicate investments in services and a probable rise in liberal morals and the merchant class |
GA |
the rise or fall in agriculture as the society gets wealthier. A rising slope indicate increased investments in agriculture as opposed to services or manufacturing and could also be a sign of austere morals or of the rise of the laborer class |
GM |
the rise or fall in manufacturing as the society gets wealthier. A rising slope indicate investments in manufacturing and likewise a probable rise in austere morals or of the rise of the intellectual class |
| Trade Ratios | Description |
|---|---|
GR |
the rise or fall in interest rates as the society gets wealthier. A rising slope may indicate the dominance of the borrowers, as a sign of liberal morals |
GN |
the rise or fall in inflation as the society gets wealthier. A rising slope may indicate the dominance of speculation, as a sign of liberal morals |
GD |
the rise or fall in public debt as the society gets wealthier. A rising slope indicates debt-driven GDP Growth, as a sign of liberal morals |
GIt |
the rise or fall in imports as the society gets wealthier. A rising slope may indicate a service country |
GXt |
the rise or fall in exports as the society gets wealthier. A rising slope may indicate a manufacturing or agri country |
In every civilized society which has the distinction of ranks, there were always two systems of morality: the strict or austere and the liberal or loose system. The austere is generally admired and revered by the common people. The loose is commonly more esteemed and adopted by people of fashion. The vices of levity is apt to arise from great prosperity.
DSIT uses the following tools to test the supereconomy in real time:
| Factor | Tool | Remarks |
|---|---|---|
| Demand | Basic Universal Revenue and the Grain Index as store of value | Grains are a better and more natural valuation basis than precious metals |
| Capital | ISAIAH Match | Knowing the skills in a society in real time is useful |
| Industry | The Economic Table | This plots the flow in a supereconomy in real time |
| Trade | Exchange systems | This allows multiple tools of trade to prevent the monopoly of exchange |
Leave a Comment
Thank you for your comment!
It will appear after review.